June MSU Apple Spray Coverage Trial
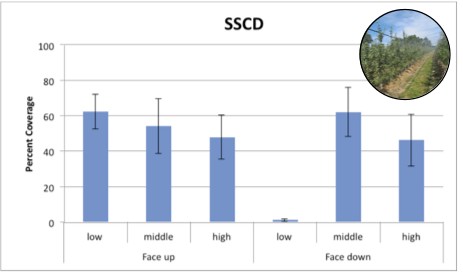
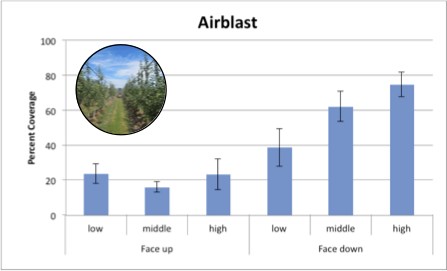
In order to record and compare the delivery deposition efficiency of the solid set canopy delivery (SSCD) system and the conventional airblast sprayer, 26 ×76 mm water and oil sensitive paper cards (TeeJet®, Spraying Sytems Co. Wheaton, IL) were strategically placed in semi-dwarf Rubinstar Jonagold apple trees at the Clarksville Horticulture Research Center in Clarksville, MI on June 13, 2012.  For these two different delivery treatments (and an untreated control) there were four randomized replicate blocks of 12 rows and 17 trees, spaced 3 x 11 ft. apart.  The weather conditions included partly sunny skies, 70 – 80 F air temperature, and east-northeast winds at 6 mph.
The cards were labeled on the backside with 1×2 5/8 inch white mailing labels (Avery®, Brea, CA) by treatment, repetition, tree location, date, and orientation of the card (facing up or down). The cards were then placed in labeled Ziploc bags organized by card position. Three different vertical locations, low (26 in above ground), middle (58 in), and high (82 in), were selected to cover the height of the canopy. These locations were measured with consistency across plots using a marked measuring stick. The water sensitive cards were then placed back to back (one facing up and one facing down) and clipped horizontally in the trees using small (3/4 inch) binder clips.
Once the cards were placed in the correct locations, then SSCD and Airblast sprayer
treatment applications were made with water. The solid set system (fitted with 0.032 inch Dan Mini Spr violet nozzles with yellow spreaders) sprayed 70 gallons over about 1 minute of time, or approximately 450 GPA. The airblast sprayer sprayed 76 GPA with a speed of 3.5 mph. After the application the cards were left in the trees to dry before being removed and placed in labeled Ziploc bags according to treatment and location. The cards were scanned by laying them out on labeled white copy paper according to the tree location and card orientation. Percent spray coverage was calculated using Photoshop Elements 8.  Mean (±SE) coverage values were presented graphically to represent relative deposition patterns of each treatment application method.
Download a printable copy of this report here (You will need Adobe Acrobat or another pdf reader to access the file).
07.06.12


Leave a Reply